DEVELOPING AN INFRASTRUCTURE PLANNING TOOL FOR THE GAUTENG PLANNING COMMISSION
Gauteng’s population could grow from the 11 million or so people in 2011 to between 18 and 28 million people by 2055.
To prepare for this significant population change, IDS was commissioned to develop an infrastructure planning tool (IPT) to assist the planners in the Gauteng Planning Commission (GPC), the Gauteng Department of Education (GDE) and the Gauteng Department of Health and Social Development (GDHSD), to identify the need for, as well as to locate, education and health facilities in appropriate places.
Critical information to enable the Gauteng Provincial Government (GPG) to deal
with this development is supplied by the Gauteng Department of Economic
Development’s Spatial Development Framework of 2010 (GSDF).
The IPT supports the generation of planning scenarios from the short, medium
and long-term development perspectives of the GSDF for the delivery of public
facilities, such as education and health services, at locations where such
facilities will be needed.
The IPT consists of three components; a database, a planning model and a
process by which the tool is managed and applied. The database and the model
together constitute the planning instrument.
The key determinants of the demand for social facilities are population
distribution and population change. As the location of social facilities
depends on access to suitable and available land, the key inputs to the IPT are
population, accessibility, land suitability and land availability.
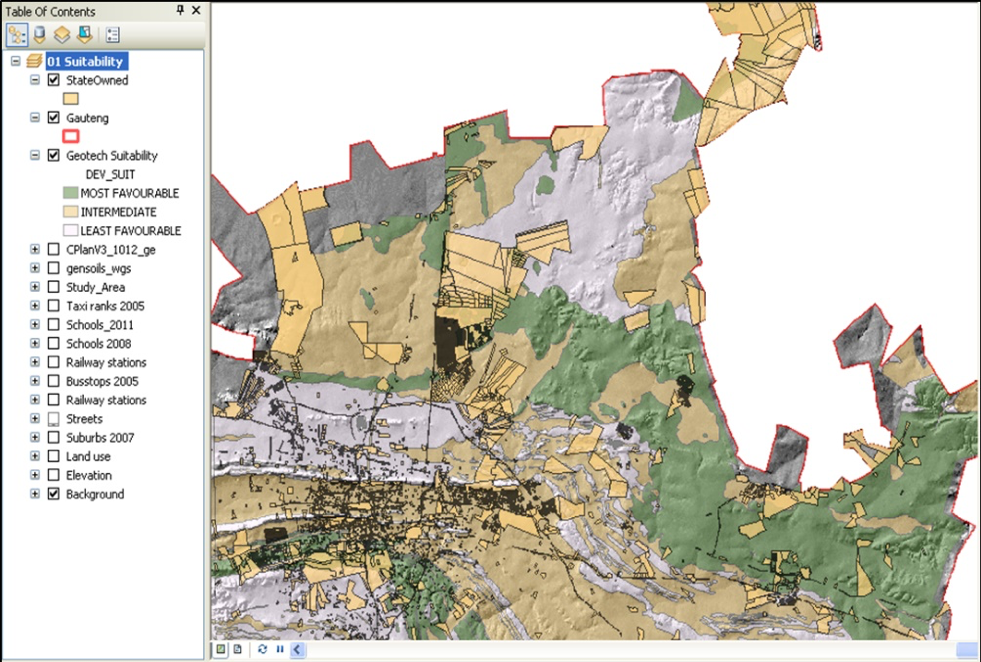
Figure 1: Suitability analysis input data
Although the planning tool can be used to identify candidate locations for a broad range of social facilities, it has been customised for educational facilities (primary schools and secondary schools) and health facilities (hospitals and clinics).
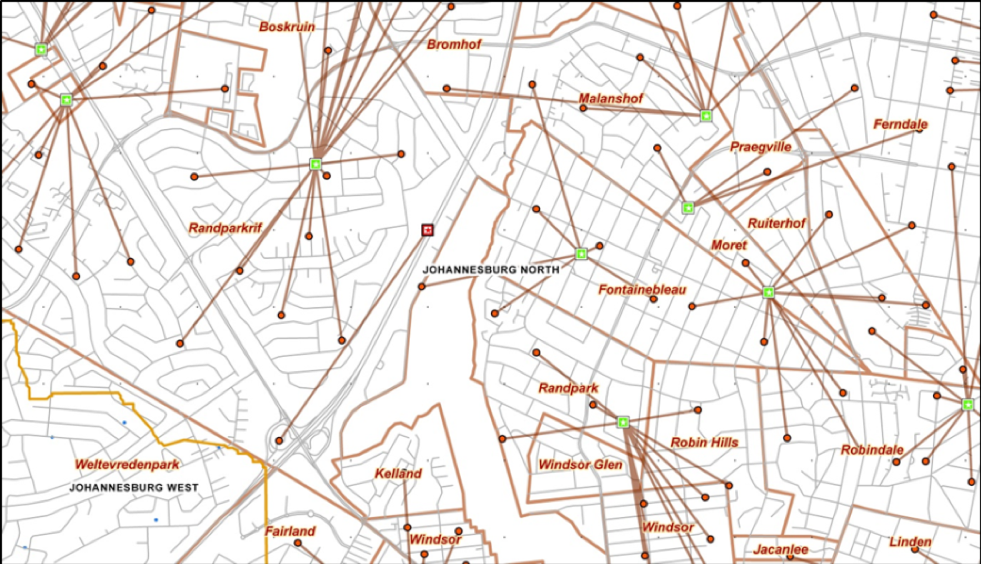
Figure 2: Facility location result
The planning tool distinguishes between existing facilities and facilities that would be required as a result of the demand generated by the existing population. It also takes into account the population change up to the planning horizon under consideration (e.g. current, current plus 5 years, current plus 10 years, current plus 15 years etc.).
Two main modelling functions enable planners to identify locations for education and health facilities. These functions are:
- Weighted overlays, which enable various user-defined raster datasets to be overlain using a common measurement scale.
- A weighting mechanism that allows each raster dataset to be weighted according to its importance in the ‘what if’ analysis under consideration
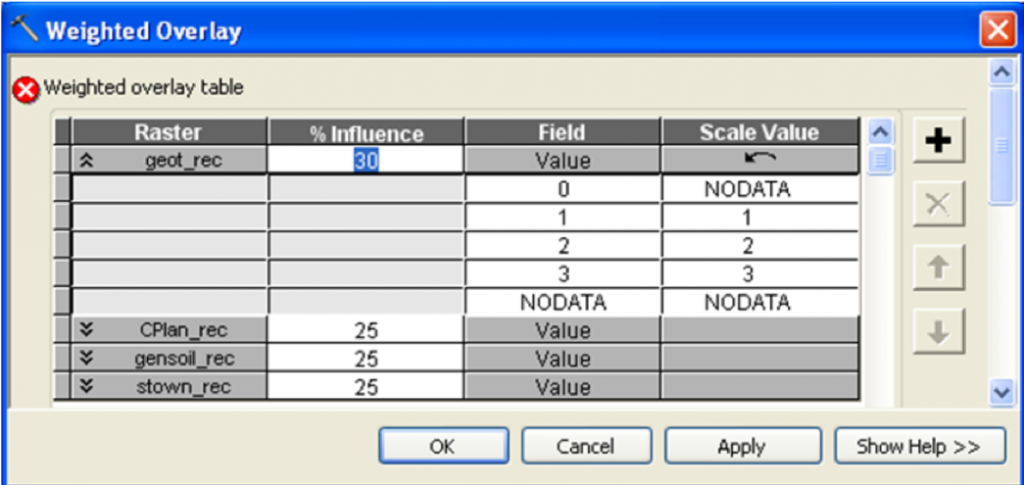
Figure 3: Weighted overlay dialogue box Location-allocation analysis, which enables a given number of facilities to be selected from a set of potential locations. A demand is allocated to facilities with a view to determining optimum candidate locations for the facilities.
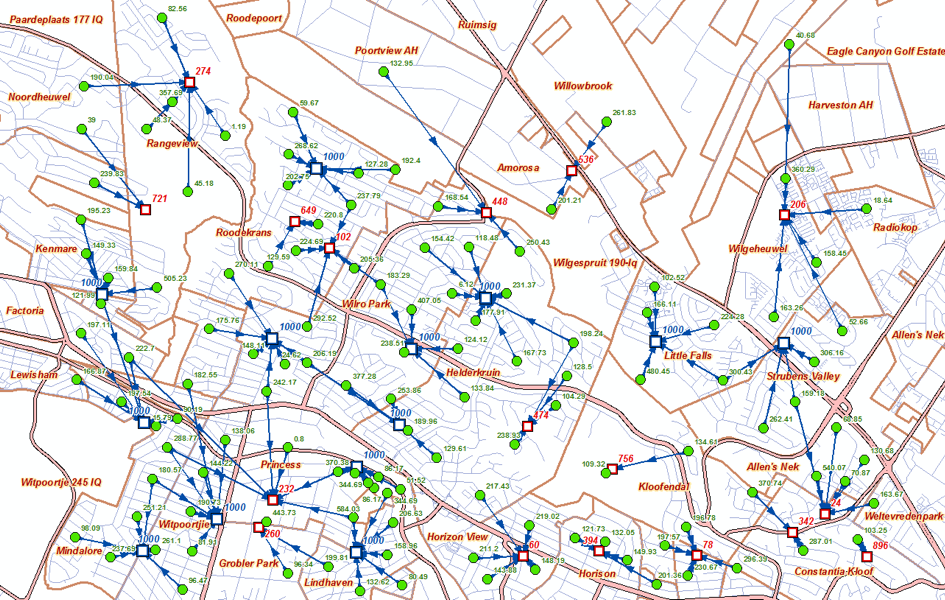
Figure 4: Optimum allocation results
Existing facilities and their exact locations are critical to the determination of new or additional facilities that would be necessitated by the demand the population is expected to generate at the planning horizon under consideration.
The function that determines the optimum location of facilities is intended to
limit under-demand and over-demand for facilities. This analysis aims to select
optimum locations for facilities to balance the expected demand the population
would place on the facilities and the capacities of the facilities that would
be planned in order to satisfy the criteria, norms and standards or legal
prescripts that are adopted.
The model can be applied to any location analysis criterion or challenge.