CITY OF EKURHULENI PHOTOMETRIC INDEX EXERCISE FOR ASSESSING LEVEL OF CLEANLINESS IN 10 CBD AND 9 TOWNSHIPS WITHIN THE JURISDICTION OF THE CITY OF EKURHULENI. – CASE STUDY
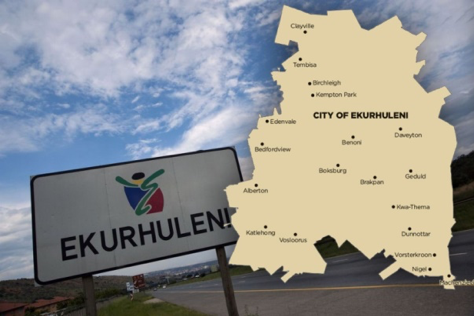
IDS was contracted to conduct an investigation to assist the Ekurhuleni Waste Management Services with the assessment and on-going monitoring of cleanliness levels within the Central Business districts and Townships of Ekurhuleni.
Using GPS and GIS systems to assist with rigorous data collection, manipulation and analysis, IDS was able to provide the City of Ekurhuleni with valuable insight into the standard of waste management in the selected areas as determined by the Gauteng Department of Agriculture & Rural Development: Gauteng Waste Standards. General Waste Collection Standards
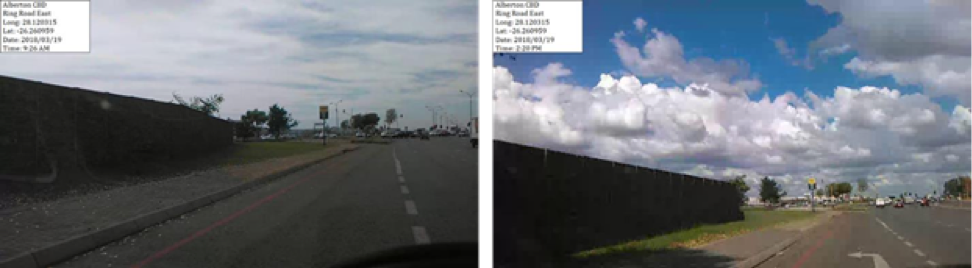
Geo-referenced surveys were utilised as the most accurate method of presenting the findings, with video and picture files provided as evidence in the reasoning of the evaluation.
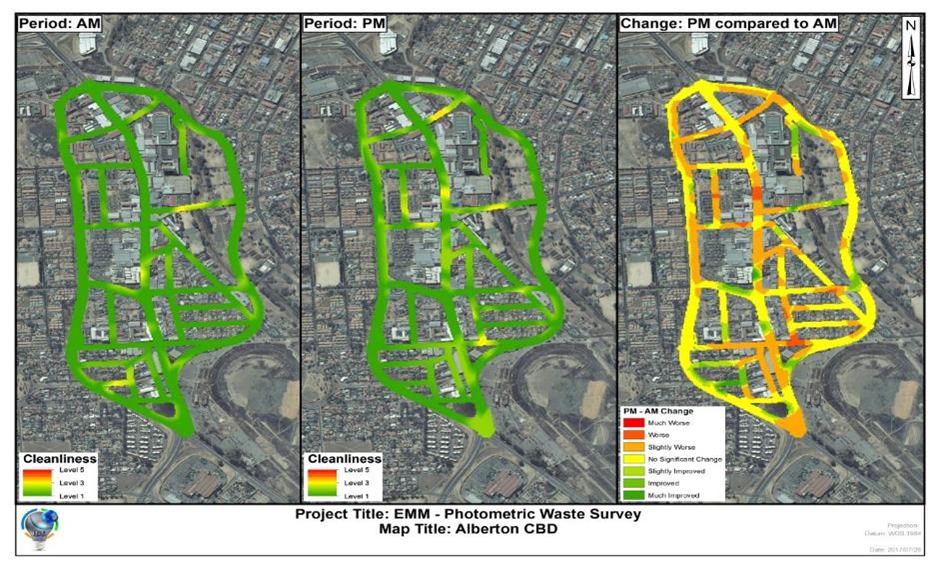
The project entailed the taking of geo-referenced photographs of each of the selected regions over a period of over a year (September 2017 to September 2018) and evaluating them against the 5 Levels of Cleanliness for Gauteng:
- Level 1: No visible waste.
- Level 2: Predominantly free of litter, except small items.
- Level 3: Sparse littering, no more than 5-10% of the visible surface contains litter.
- Level 4: More obvious litter, up to 30% of the visible surface contains litter.
- Level 5: Dense Littering, More than 30% of the visible surface contains litter.
Each of the 19 selected areas, (the Central Business Districts of Albertan, Bedfordview, Be noni, Bloomsburg, Brakpan, Edenvale, Germiston, Kempton Park, Nigel and Springs as well as the Township areas of Etwatwa, Daveyton, Tsakane Duduza, Kwa-thema, Tokoza, Katlehong, Vosloorus and Tembisa) was monitored individually by means of two sets of geo-referenced photographs – one taken in the morning and another in the afternoon, of each day. The changes observed between the two photometric datasets were depicted on maps in a 5m2 raster dataset and the average level for cleanliness could be similarly calculated based on the same dataset.
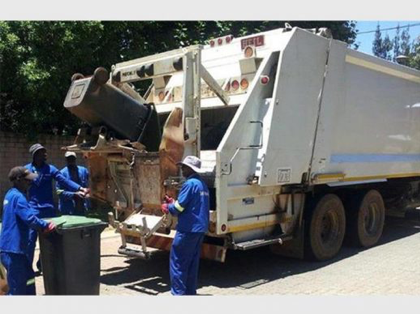
Monthly data collection and analysis ascertained whether the areas were receiving consistent uniform waste collection and cleaning services to a level that was both environmentally and socially acceptable to the community as determined by GDARD: Gauteng Waste Standards.
IDS project managed all tasks from inception to close out; including client liaison, data collection via video capture of the street, analysis of all data and map-generation as well as monthly and quarterly reporting.
With the data received, the department was able to bring this intelligence to bear on its forward planning and decision-making procedures around Waste Planning and Waste Infrastructure, as well as implement immediate corrective measures where necessary.
The result was a much more effective and well-informed procedural improvement for the Waste Management function within Ekurhuleni.